
An Accessible Goaltending expected Statistic.
How to better understand goalie performance above baseline without having to explain Fenwick SV%

I started out with a question: how many xGoals just flat-out miss the net and should that affect how we view goalies? One download of MoneyPuck’s Goaltending Statistics later plus — actually, I don’t know how long it’s been — less than a month later, I still don’t know the answer to that question. Most xGoals metrics will say “well, we have the data for all anyways, so why change the denominator from unblocked shot attempts to shots on goal when looking at goalies? The entire point of the metric is that over a large enough sample size, it’ll predict the same number of goals against league-wide.”
And that is true and valid. But I’ve never found that satisfying. The unavoidable critique of using GSAx is that it is wholly blind to goaltender action besides: Puck Go In? — 1 or 0. It’s problematic because there is a very crucial difference between making a save on a high-danger opportunity and a shooter missing a wide-open net. There has usually been an assumption from most models as well that goalies have some degree of control over which pucks miss the net and which ones hit the net. In some cases, that’s definitely the case, but it’s not necessarily something you can predict.
There’s a principle I sometimes invoke that I call “shooter-goalie incongruency”, which I use when I find that a particular measure is repackaged for measuring goaltenders without too much thought regarding it’s actual utility, or what hidden variables are being missed. It’s a fancy way for me to say that some measures are useful for shooters, but not for goalies, typically because the folks with the puck will always dictate a hockey game. For example, I will frequently recontextualize SV% as Opponent’s Shooting % because those two work very well in tandem together, especially in the context of a single playoff series: there’s little incongruency there. But I actually first coined the shooter-goalie incongruency term to critique NHL EDGE’s over-division of chances. I’m more wowed by Draisaitl’s shooting percentage on shots to the right of the net than I would be concerned by a SV% with similar deviance from the league-average on the same area of ice. Goals count the same no matter where they come from and the goalie can’t decide where shots are taken from or who’s shooting it, so I’d be more concerned with the overall SV% if anything. Draisaitl over-performing what’s normal in that case is part of why he’s elite. It doesn’t have anything to do with goaltending.
One framework that I’ve really appreciated, and has lived in my head rent-free since I first read it is Aaron Knodell’s Expected Saves . Knodell’s framework is very similar to most xGoal models, but it focuses on measuring goalies exclusively. What mainly differentiates it from the public xG models (besides some choices of factor weights that he explains in the article I’ve linked) is the choice to count posts/crossbars as goal-equivalent inputs, designating each as “a shot attempt the goalie should have saved, but didn’t”.
This innovation seems a little harsh at first — certainly compared to most xG models giving goalies “credit” for shooters missing the broad side of a barn (yes, I know, it kinda works, but again, I find it unsatisfying)— but Knodell points out that it increases the predictive power of the model, which is awesome. I will now also explain how it also makes more sense as a more precise model for goalie action given how little input on that we get from NHL shot-tracking data.
Firstly, going back to my main critique of xGoal models and Fenwick (unblocked shot attempts)-based measures, is that they are useful for measuring offence — if you’re expected to hit the net and you miss the net, you’re never going to score like that, so it makes sense that you’d underperform your xG on that shot attempt given that you’re the genius who shot the puck — but run into issues when assigning overperformance to goalies. We don’t have data on the degree to which a shot misses the net. It’s recorded in discreet categories in the pxp data. Knodell correctly identifies that posts and cross-bars act as the literal boundary between misses and shots on goal. But if a puck hits the post, it definitionally missed the goalie, and at NHL skill-level and speeds, the difference between hitting the post and it going in or hitting the post and it bouncing out is functionally just a matter of luck.
For example, take this still image and ask yourself from an evaluative perspective, “was this really a ‘save’?”
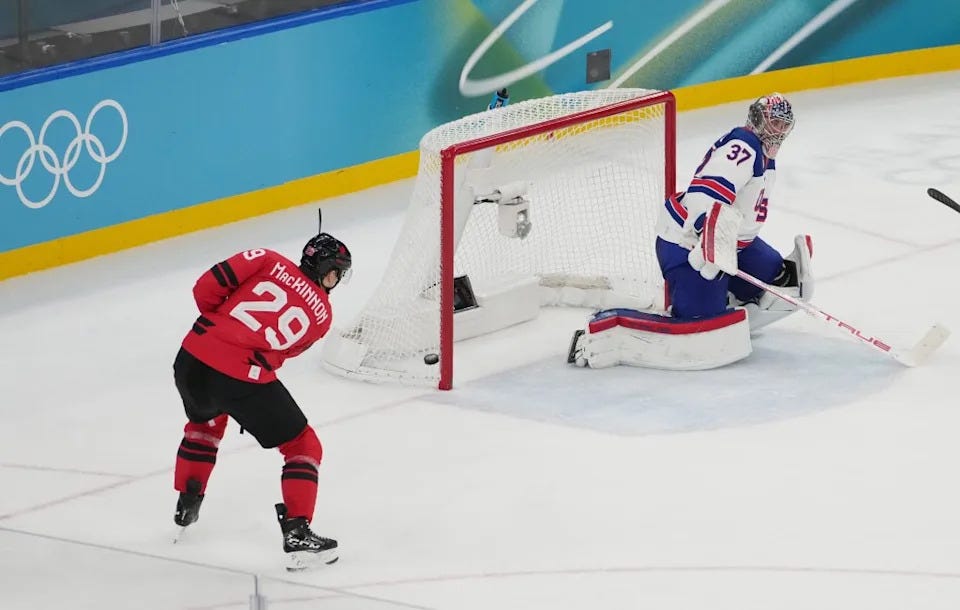
The only place where we might consider this innovation to be somewhat inaccurate is for dead-angle, RVH-type plays where the goalie is sealing the post. But even those are fairly rare and the shooter will generally select for shots they think they can make.
The last thing to consider is that if we want to turn xSaves into a rate performance stat, the formula is [(Shots − (posts + goals))/(Shots + posts)] − [xSaves/(Shots + posts)] to get saves above expected. The last advantage to this framework over xGoals as a means of measuring goalie performance is that it will generate rate stats that are more recognizable to most fans and thus may be more intuitively understood.
Like I’ve said, Knodell’s framework has lived rent-free in my brain for the past two years— in fact, probably leading to my initial question, now that I think about it. Now, all that said, what have I come up with.
Well, I didn’t make a framework from scratch, but I did make some adjustments to the way MoneyPuck’s data could be presented.
Expected SV% Adjusted
2025-26 has not be kind to xGoal models. MoneyPuck had to rejig their model halfway through the season to account for seemingly every goalie being above expected and Evolving Hockey has kinda just left theirs as is. The cause of this is the NHL updating its data recording methods for shots on goal with the advent of NHL EDGE. But while MoneyPuck recalibrated their model for this season so that the balance between expectations and results is fairly even, but there’s still a lingering problem: in 2025-26, no goalie that played more than 3 (three!) games had an OnGoalAboveExpected% above 0. That means that 87 such goalies experienced more pucks missing the net than MoneyPuck predicted. While likelihood of hitting the net is baked into xGoal models, those misses are still “saves” according to the models for the goalie not actually doing anything to influence the shot. So, I decided to adjust xFenwickSV%, which is 1−(xGA/UnblockedShotAttemptsAgainst) to put it in terms of shots on goal, and thus make it comparable to SV%, which thankfully is starting to overtake GAA as the basic evaluative stat of choice in public discourse. While MoneyPuck doesn’t show how many unblocked shot attempts it expects to be on goal, it does if you download their data, so doing that, I used each goalie’s individual number as the denominator for my xSV%, and then multiplied it by the League-wide expected OnGoal divided by League-wide observed Shots on Goal to match the denominator of actual SV%’s. The adjustment I’m making is that I’m assuming every goalie faced shots at the league average rate of observed shots on goal compared to expected shots on goal.
The math for this is 1 − (xGA/xOnGoal)*(Lg_xOnG/Lg_OnG). And below is the chart for the xSV%adj and SV% of all goalies with a minimum of 900 minutes played sorted by the former statistic.
What I like about this framework is that it puts xGoals into a framework more familiar to the public, so you could more easily explain to a casual fan: “hey, Stuart Skinner’s 0.888 SV% isn’t a bad result, because it was basically what was expected of him given the shot quality he faced” or “Jesper Wallstedt’s 0.915 SV% is very impressive, but it’s somewhat expected given he faced shots of lesser quality on a per-shot than, say, Logan Thompson’s Vezina-calibre season”.
The one caveat I have is that this framework creates a distortion by normalizing the rate at which players miss the net against a single goalie is mostly just noise. It makes this measure imprecise, and abstracted by a layer, so I wouldn’t necessarily use this over dFSV%.
But again, the point is converting dFSV% into terms that are more familiar to the average fan.
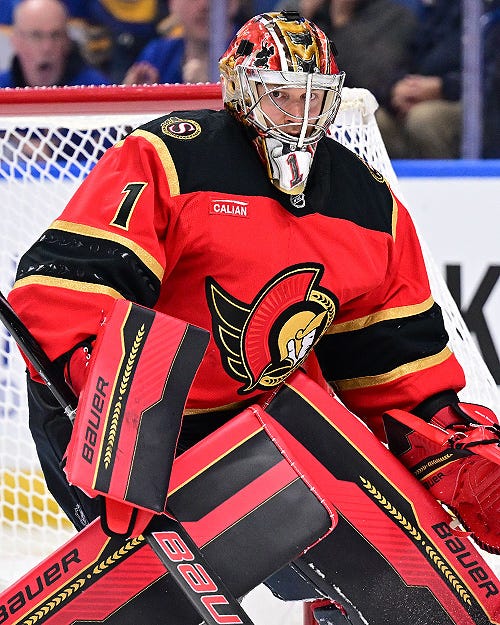
Basically, this is a way one could explain SV% fairly neatly — which is useful. Even among folks who do list xG-related figures in reference to goaltenders tend to do so only use GSAx. Can we really say Jordan Binnington was the worst goalie in the NHL last year when it doesn’t exactly take a genius to figure out Leevi Meriläinen almost overtook his volume in half as many games? It’s much more intuitive to a fan to say “hey, given that we should have expected both Binnington and Meriläinen to post 0.893 SV%s, Meriläinen’s 0.860 is incredibly bad whereas Binnington’s was merely just very bad.”
One last caveat to note is that a goalie having a low xSV%adj does not mean they played behind a bad team necessarily. I think when measuring team defence, volume and danger need to be balanced against each other — because defence influences both — meaning xGA/60 is still the way to go, whereas for goaltending, they have zero control over (initial) shots and opportunities they face. This is why we need a rate stat to measure goaltending, and xSV%adj makes use of publicly available xGoal models to set baseline expectations that may be less accurate, but are more comprehensible.
Great article, and much better than using GSAx. Counting stats make no dang sense for goalies.
It continues to be baffling to me to treat misses the same as a saves from the goaltender's perspective. I think goaltender's have some influence on whether a shot is on net or misses, but the weighting between saves and misses shouldn't be even. Team defense should also have some impact on misses (less room for the shooter should make a miss more likely).
I think the best underlying metric for a goaltender has to be tracking based. Measuring their positioning relative to the puck at all times and reaction time/accuracy on shots towards them.
Appreciate the shout out! The NHL kinda blew up my model with the PBP changes; posts/crossbars increased about 150% from 2023-24 to 2024-25 making every goalie look awful the last couple of seasons. I've been thinking of revisiting it with some kind of dynamically updating model to try to account for changes in recording/gameplay.
Great article.
You mentioned "if a puck hits the post, it definitionally missed the goalie" is not necessarily true. A puck can glance of a goalie, then hit post. After that it could be a goal, or a save, which as you say is functionally a matter of luck.
I agree with Aaron that goalie tracking is required to get the best underlying metric for a goaltender.