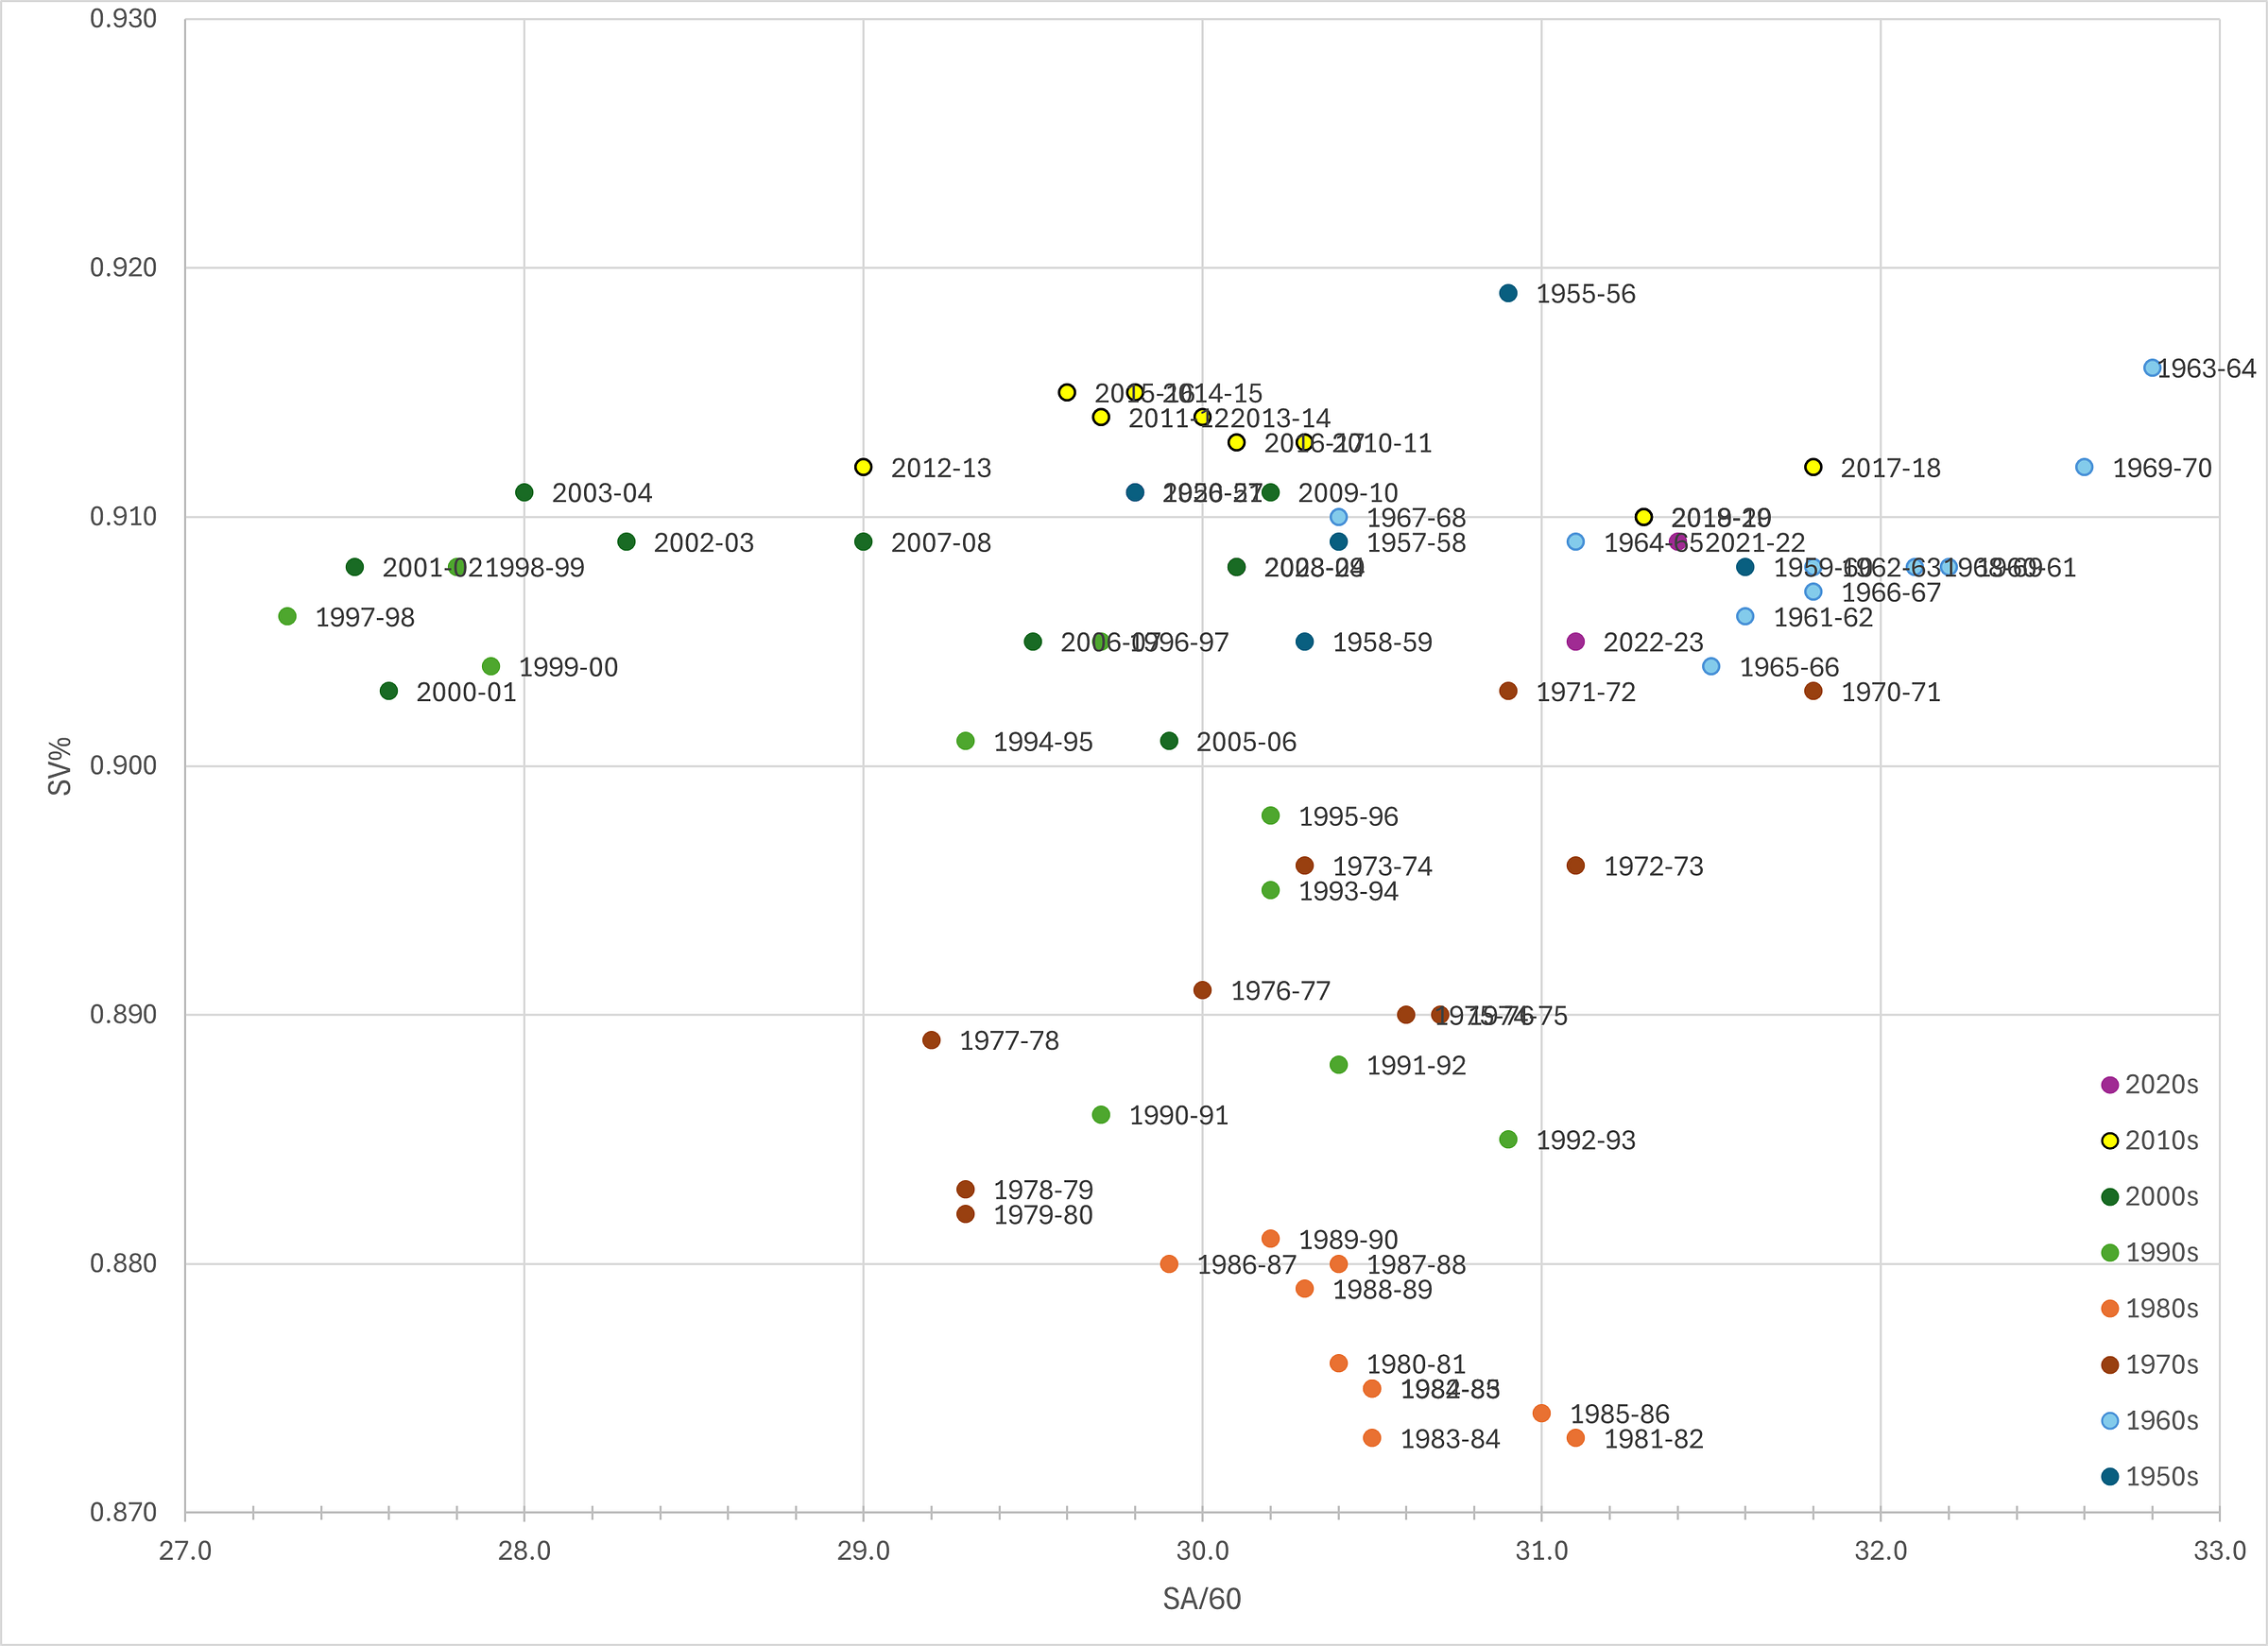
Goals Saved Above Average or GSAA is something I like to use a lot. Save percentage is the rate a goalie makes saves. GSAA takes that save percentage, turns it back into a quantity (i.e. Goals allowed) by multiplying it by the number of shots a goalie has faced, but then compares that number to what a league average save percentage would yield on the same number of shots.
In numbers it looks like this:
GSAA= (SV% x SA) − (avgSV% x SA)
The brilliance of GSAA is that it accounts for rate at a certain volume and makes it relative to the league average.
Problems
There’s just a minor problem with this that arises from comparing these together. The league average is always season-relative, and shots against totals vary from season-to-season and team-to-team even within those seasons. As we can see from the graph below, different seasons/eras create different environments.
In order to account for this, we need to find a way to adjust those numbers to for comparison across environments.
Adjustments & Calculations
For this statistic, I adjust 2 things.
League average SV% is adjusted for each season to .900. This is actually not only a nice, round number, but also the average of all league average save percentages from 1955-56 until 2023-24 (i.e. every season we have data for). It’s also widely considered good to score on at 1 out of every 10 shots.
Shots against/60 is adjusted to 30.0. This is the weighed average (i.e., the average, but seasons with more games played influence more than those with less) of all seasons since 1955-56. Additionally, if we set our league-average adjusted SV% to .900 and our league average adjusted SA/60 to 30.0, this actually gets us Hockey Reference’s base goals against average of 3. This confirms both these numbers as feasible.
GSAAadj in action
To calculate GSAAadj we take our adjustment number .900 or as it’s typically notated 0.9 and divide the league average from the year we’re calculating for, excluding the stats of the goalie in question. This yields an adjustment rate. Next we multiply the goalie’s sv% giving us the adjusted save percentage.
For example, if we were to calculate for Dominik Hašek’s 1997-98, we’d divide 0.900 by the league average sv% without Hašek. That’s 26,330 saves 29,102 Shots against for the season. Subtracting Hašek’s totals (2002 saves and 2149 shots against) gives us a sv% of .903 and an adjustment rate of about 0.9967. Multiplied by his actual save percentage of 0.932 yields an adjusted SV% of 0.929.
The next step is to adjust the number of shots such that 30.0 SA/60 is league average. To do this, we start the same way: dividing 30 SA/60 by the actual league average. We then multiply that adjustment rate by the actual number of shots against.
Returning to our previous calculations for Hašek’s 1997-98, the average SA/60 was 27.3 — one of the lowest seasons on record! 30.0/27.3 yields an adjustment rate of 1.098901. Multiplied by Hašek’s shots against that year of 2149 gives us an adjusted shots against of 2361
We then multiply the two together to get the number of adjusted shots saved, which is 2193.2
Next we need the comparative average results. Lucky for us, 0.900 is already league-average for this calculation, so we just need to multiply the adjusted shots against (in our Hašek example, that’s 2361.5) by 0.900. This results in a 2,124.9 baseline. We then subtract 2193.2 by the 2,124.9 baseline to get the final GSAAadj of 68.3
How does this compare to his actual GSAA? Well, his actual GSAA that year was 54.5. That’s a difference of 13.8 GSAA — a pretty significant adjustment considering 13.8 would be a very respectable GSAA over a season of work.
What kind of seasons does this most affect?
Well, let’s consider first what goes into making a big GSAA in the first place. Remember, the formula looks like this:
GSAA= (SV% x SA) − (avgSV% x SA)
So in order to save a lot of goals above average you need a SV% that’s significantly higher than league average and/or a high shot volume. So seasons that benefit the most from this are going to be seasons with a lower average SV% or seasons with a lower average shot-volume. This is going to benefit seasons that are furthest away from 0.900 league-average SV% or 30.0 SA/60, as well as individual seasons that are outliers to their respective environments in those respects.
Between sub-0.900 SV% seasons and sub-30 SA/60 seasons, the latter will typically result in a greater adjustment than the former.
Overall Impact on Goalie Discourse
The impact on Goalie discourse is subtle, but important all the same. The adjusts don’t cause a wild variance by any means for most seasons, but the principle is what’s important here: when trying to compare across eras, we need to account for the environment in which the players we discuss play. Curtis Joseph’s 1992-93 is 4th all-time by GSAA, but by GSAAadj, Dominik Hašek’s 1997-98 ranks higher.
These adjustments are slight, and this is why a stat like GA%- is always a good companion to GSAA, because 100 is always average. But GSAAadj still allows the quantity aspect to which GA%- is neutral, while still putting every season on an even playing field. Which is, after all, the entire point of adjusting stats.


