
My Issues with NHL EDGE
How to Half-Ass Your League’s State-Sponsored Data

In 2015, MLB launched the website Baseball Savant. A remarkable website that makes publicly available a wealth of data that are used to make legitimate baseball decisions. It purposefully plots percentiles and points to piece together a perspective on a player’s playing process. Baseball is my second-favourite sport — and it’s not close in either direction — but Baseball Savant is my favourite sports data site (with great respect to the work done on hockey sites like Hockey Reference, MoneyPuck, and Evolving Hockey).
Is this like comparing apples to oranges? I don’t think that’s a good analogy — it’s more like comparing maize to some variety of wild grains. Similar purposes, yes, but one, by years of care and cultivation, will be much more productive.

But as a hockey fan, should I not have rejoiced, then, when the NHL came out with the NHL EDGE website? I didn’t. And nor should I have.
Now, NHL EDGE is not devoid of data and other info. It has a lot of data available on each player that’s played in the NHL since its implementation. It’s also, as of right now, much more user-friendly than it was previously, and has a very nice ice-inspired colour scheme and visual motif. It has some very interesting and useful data categories — the skating data, especially, is the perfect embodiment of what EDGE (and only EDGE) can offer. There’s already been fascinating analysis derived from these numbers, some of which you can find here on Substack. Shot velocity is also interesting and useful. But there are many shortcomings inherent to the endeavour as it stands that form a ring around a central sin of non-ambition.
Now, my displeasures towards EDGE are well documented on this platform in the 6+ months since I’ve first looked at its data. I remember the feeling of FOMO I had before I had looked. Had I been too arrogant about my typical avenues of analysis that I had been depriving myself of more useful information — a trap I can and have sometimes fallen into. Imagine, dear reader, a most regrettable feeling of vindication wash over me as my eyes poured over the stats page of Jake Allen. It was really carelessly compiled. And while I had no reason to doubt the accuracy of what I saw, I had every reason to question the worth of aiming for some of it.
Statistics matter because they can describe characters, depict circumstances, and retell events; they can tell stories. Just read anything written by
and you will witness the context-building power of a good statistical analysis. But they can only do this authentically when there is care in their selection, precision in their implementation, and understanding of their own shortcomings.Ultimately, my frustration towards EDGE stems from its inability to tell me, an analyst of goalies, anything meaningful.
Stat selection
Percentiles are an excellent statistical tool. Punting the idea of an absolute measure in favour of understanding the relation between individual results is incredibly useful for many situations. Many people, I’d imagine, they may have last interacted with percentiles in relation to something like a standardized test, where, since there needs to be a new test each year, results can only be understood through percentiles and normalization of results, not absolutes.
Baseball Savant understands this. The first thing you see on a Baseball Savant page are a slew of various percentile measures (or where someone would fall within those if their sample were big enough). The other nice thing about percentiles is that they allow for a level of precision that most folks won’t choose to exceed: a 0-100 scaling.
So having been handed this kind of thinking, the designers behind NHL EDGE decide to group these percentiles into 3 progressively smaller groups. These 3 groups are < 50, 50-79, and >80. I suppose this makes some sense, but not when you look at the stats these are applied to.
See, NHL EDGE loves to count things. This is fine, because many stats are typically, at their base, things you count. But when you count something, you can’t understand what it is you’re counting unless you understand what kind of opportunities something had to occur. So when EDGE tells us things like how many shots a goalies has faced all season or how many bursts a certain skater has, that’s going to skewed how much hockey that individual has played. Combine that now with the extremely broad categories and these percentiles suddenly tell you nothing useful.
There’s also the fact that they don’t specify the actual measure of anything in the <50th percentile category.
And NHL EDGE bowed its head solemnly and spoke: ‘There’s actually zero difference between 49th- and 1st-percentile outcomes. you imbecile. you fricking moron’.
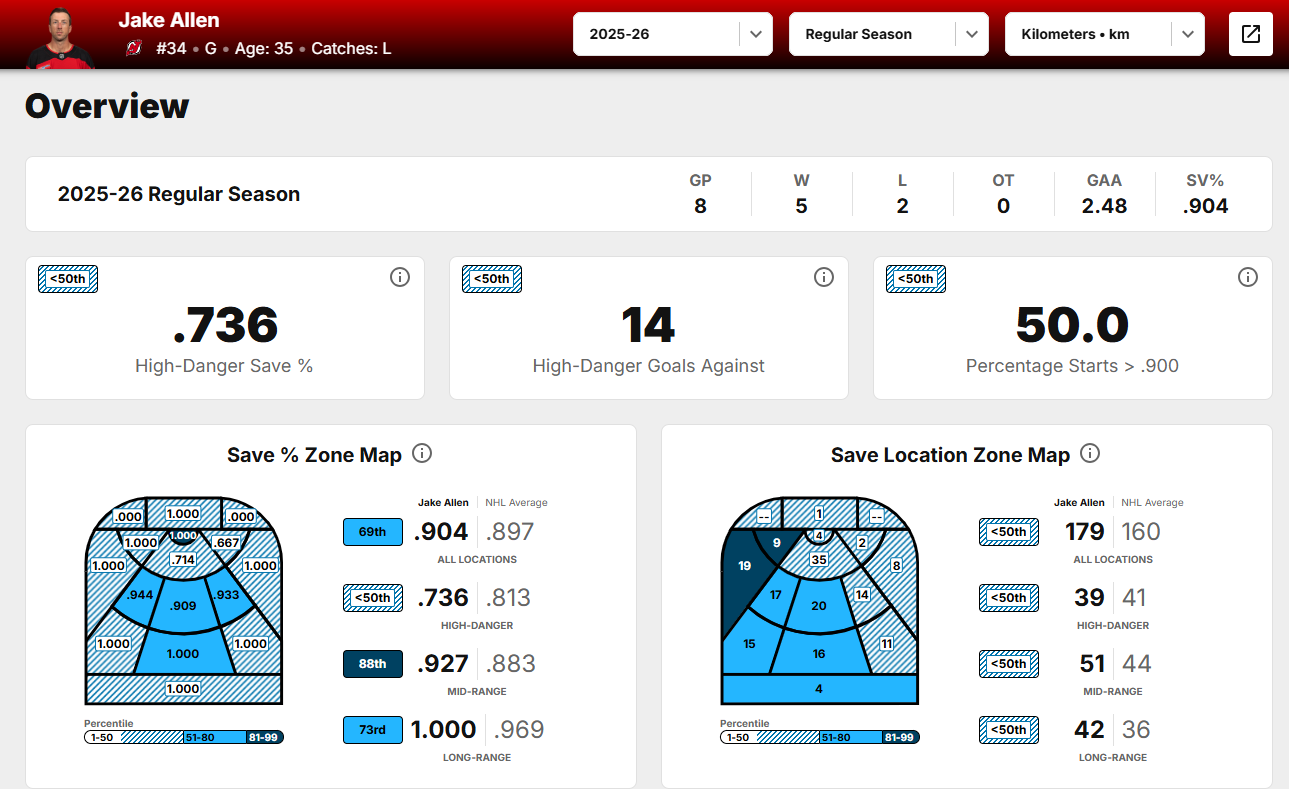
Despite appearing in over half of the Devil’s games, Jake Allen has less than a 50th percentile number of saves. For starters (and backups), using saves as a default outcome measure is ridiculous. There’s a tangible scoreboard difference between making 10 saves on 10 shots and 10 saves on 15 shots (I’ve done both, if you don’t believe me). So saves are useless without context, which shots against would better describe. Then there’s the SV% breakdowns. Jake Allen has a 69th percentile (nice) SV% across all locations. That’s good. But he has <50th percentile SV% on high-danger chances… That’s not ideal, but since we don’t know the exact percentile, we don’t know how much of an issue that is. His 88th percentile SV% is very good, but his perfect long-range SV% is…73rd percentile. That’s somehow not very informative. I’ll have more to say on the SV% maps below, but this just demonstrates how unhelpful some of this data is. For those of you, who, like me, are wondering how Jake Allen is actually playing, he currently has a dFSV% of 1.55 according to Evloving Hockey, which, for comparison, is similar to how 2024-25 Vezina Finalist Darcy Kuemper played last season (dFSV% =1.54) or even how Allen, himself, played (dFSV%=1.51)
And non-selection
With the goal of explaining the state of goalie stats to layfolks, I’ve often pointed out that while GSAx and xG models are the best publicly available statistical sources we have for goalies, we are still faced with a difficult situation that those models are blind to goaltender action. But even still, these xGoals are great macrostatistics. Why the hell, then, does NHL EDGE pay these very statistics no mind? They would not have to reinvent the wheel, here. They could, having unique and immediate access to the same or more data that public models have, found a way to integrate their own skating data into their own proprietary xGoals model and have access to so much more data for every player. Like, almost every publicly available xG model has their own methodology/explainer written somewhere. It’s meant to be repeatable and replicable!
Again, no need to re-invent the wheel here! But their data could hold some super neat insights! Like, I don’t know if they could isolate the speed of a player when they release the puck or distance travel in the last 5 seconds to the point of release are both things I don’t think any model accounts for right now. We don’t need to see the bones, but you don’t calculate things like distance skated, etc without those bones existing. If you have the data available, not pushing it further is a plain lack of ambition.
Goalies
And lastly, there’s my main analysis subject: goaltending. Goaltending is a difficult subject to analyze, I won’t deny it. Goaltending analysis has a couple of issues that are in direct tension with each other.
First is the tension between sample size and repeatability. In theory, 5v5 is the most repeatable mode of play in hockey for all parties. But the amount of 5v5 play needed to stabilize anything meaningful for goaltending requires a large sample that can only be built up over time. Speaking anecdotally, goalies’ level of play can fluctuate slightly over a season due to factors like fatigue. So, we cannot have immediate, skill-accurate measures of goaltenders. Any conclusion-derivable sample we have will typically be comprised of different levels of play.
On another very basic level there exists the tension between the eye-test and statistical analyses. The former is so incredibly context-rich, you can learn so much about process from just one clip. Unfortunately, the eye-test is too context-rich — to the point of long-term near-meaninglessness. Goaltending and its other-sport analogues (goalkeepers in soccer, water polo, handball, field hockey, etc.) are almost entirely passive/reactive as trade off for being entirely specialized and solely dedicated to making saves. This means that there are very few actions that are taken solely by goalie initiative and not responding to puck-carrier stimulus. I’ve written on this conflict and ways to potentially resolve this matter and measure goalie decisions, but it quickly devolved into more skill-based measures — which is the purview of NHL EDGE.
Measuring Goalie Decisions

Back in October, I published an article on a skill-based goalie metric. It’s a wishlist and a pipedream rolled into one. I’m proud of that article, and maybe there’ll be the day where the ideas can be transformed into something actionable, but not yet.
Some of my ideas are similar to what NHL EDGE measures in terms of skating, but the agency is different for sure. Having watched my share of film breakdowns (mostly by
on Substack and HockeyPsychology on YouTube) you hear about elite forwards using their speed in different ways. When Nathan MacKinnon bulldozes past a defender with the puck, that is a choice he makes and is reflected in his bursts. When Nikita Kucherov enters the zone and changes his speed, he is making a choice as well, that is marked by his fewer bursts. We know these two are comparably valuable as play-drivers — flat-out among the league’s best at that skill — but their methods are completely opposite. As soon as MacKinnon gains the zone, he simply barrels forward to create even more space for himself whereas Kucherov will create space by easing up so as to create space via the decelerated speed differential. As much as I value speed as both viewer of hockey and a customer of ‘independent pharmaceutical distributors’, it’s not at all predictive of effectiveness. But insight into how a player can use their speed to influence the play around them is still incredibly valuable and represents another step in hockey data.But that’s with the puck on your stick. At 5-on-5, as few as 11 players will not have that kind of opportunity at any one time. We then might expect to see bursts used in pursuit of puck-carrier. But that’s a responsive use of speed — still useful, but not as elastic per se. Once again, I find myself torn between two mindsets: one is that were speed-tracking for goaltenders possible, it would have been implemented; the other is that if there were interest on the part of NHL EDGE, they would have found some direct or indirect measure already. I mean, I’ve been racking my brain for months and have my own suggestions — and I’m not even on their payroll! What makes this wicket particularly adhesive is (a) the fairly high likelihood that both of my statements are simultaneously true and (b) the fact that they’re indistinguishable from the outside. We do have the corroborating evidence of the non-ambition of the rest of this project, but that doesn’t answer the question if it being possible.
So, since we don’t have that same access to process data, we’re left in the dark regarding many questions.
How would this data be useful? What made prime Carey Price special was his not only his economy of movement, but also the fact that that very economy of motion enable him to have an extra gear in his back pocket. But assumedly he lost that at some point as he largely struggled in the back half of his career due to overuse and injuries. But was that the true cause? You’d have to do very careful and detailed comparative analysis that may or may not be representative of his play on the whole. A change in statistical profile mixed with a change in results would suggest an explanation.
SV% by Zone and Why I don’t Care About It
This is something I’ve already had the pleasure of discussing in a previous article, but SV% by location is dumb. Like… I actually can’t think of a single way this would be useful on its own. To be clear, I think it’s useful to know what league average SV%’s are by zone, but not individual goalies. SV%’s advantage is its weakness: it’s a context-indifferent result stat. A shot is a shot and a save is a save and a goal is a goal.
Now, you might think that breaking down SV% by location adds context to the stat and thus makes it stronger, but you’d be wrong because you’re not enriching the actual SV%, just limiting its scope.
We’re also faced with the issue of shooter-player incongruency. Shooter-player incongruency is an idea that I’ve just coined a name for which can be explained with the extremely intuitive statement that the data that is useful for understanding shooter behaviour/performance is not necessarily useful for understanding goalie behaviour/performance. For example, shots taken from the right hand side boards by the corner is bad if you’re anyone but Leon Draisaitl. Letting in goals from there is bad for any goalie, but realistically, no one will hold that against you if your overall SV% is good. Leon Draisaitl can choose to just rip them from bad spots: goalies can’t decide where those shots are coming from. So NHL EDGE’s zone maps are a little like catching up with an old friend and them asking about what everybody else is up to except you: it’s good information to relay, but I thought you’d care about what I’m doing :(
There’s also the fact that being below average in some of these categories doesn’t really mean anything. Connor Hellebuyck was below 50th-percentile in SV% on shots from the blocker-side boards in 2024-25. That didn’t seem to be an issue to the Hockey Writers’ association who voted him as the Hart Trophy winner. Similarly, Hellebuyck’s stats at time of writing are excellent according to EDGE, but his Long-Range SV% is below 50th-percentile at 0.968! HE’S WASHED!!!
Or these stats don’t mean much of anything because you can’t really compartmentalize goalie contributions by shot location alone as all shots on goal are goals if they are not saved. I’ve often preached process over results, but save location just segregates results across a variable over which the goalie has little-to-no influence.
It’s more sound, in my mind, to say that Connor Hellebuyck is an elite goalie because he stops shots at an elite rate relative to the rest of the league than it is to say he’s elite because he stops shots from certain places at an elite rate. The latter flows downstream from the former.
Conclusion
As alluded to earlier, I don’t want to hate NHL EDGE. And in many ways, I don’t. I’m grateful it’s exists because if it didn’t already, I’d otherwise expect it to never materialize. Data like this is just not something the NHL is particularly known for doing. So what I’m left with is the more intimate feeling of disappointment than the less involved feeling of resignation. I hope it improves. I hope it grows. I know some people find it useful already, but I’m not one of those people. Not yet. Not until it grows.
But for as much as I don’t want to hate NHL EDGE, I will, as someone looking to help push our understanding of the game to new levels, try to hold it to a high standard. My expectations for it will always be high. And I’ll probably overstate it’s shortcomings.
What makes me especially sensitive to this database is how it’s presented. It calls itself advanced. It’s a bit of a loaded term to use with the public — and coming from the NHL itself, it doubtlessly commands legitimacy. The league itself commissioned and facilitates the collection of this data: it is endorsed by the league. It lends a legitimacy that is greater than its usefulness, and that is an issue.
A more descriptive name for EDGE would be “NHL EDGE: Shot and Skating data” , and were it thus dubbed, I probably wouldn’t beef with it that hard. But worries me is that this is what passes for advanced stats in the NHL. Why is this considered “advanced” when there is so much more that can be done with this data? What truly worries me is that the NHL will consider this advanced and have no desire to advance further.
Great work as always. Your comment about the eye test is fantastic, and really illustrates why people seem to think this is the only way to understand hockey: it gives you all the context you need - or rather, the context you think you need.
Also, if you're looking for quality YouTube analysis, I don't think anyone does it better than Along The Ice Hockey (if you haven't already heard of him).
https://www.youtube.com/@AlongTheIceHockey
Agree it's totally worthless for goaltenders, there's nothing in these "advanced" stats that hasn't been available for almost twenty years now. For skaters, I think it's more trivia than useful, and that's after spending a lot of time trying to dig into what's worthwhile. On occasion, I've found it useful for explaining things not captured in regular advanced stats (Jason Robertson somehow even slower at the start of last season while recovering from offseason surgery), it mostly doesn't add anything though.
I think the biggest problem is the lack of transparency. They show only season totals, they don't break things down by game state, except for zone time (also, puck zone time would be more interesting than player zone time) and distance skated, the two things with arguably the least utility, and the biggest thing is there's no table view except for the top 10 for each category. You have to go to each player's individual page to see what their numbers are. Something this clunky has to be intentionally designed to be difficult to use.
The interface is slightly better this season, and on the backend they've added API endpoints, so it's a bit easier to scrape the data, but still, it's very clearly not Baseball Savant.