
The Choke Index
Quantifying Degrees of "Shoulda-won"-ness

choke /tʃoʊk/ — V. (sports) To lose a game or series of games that the speaker believes the person or team in question should have won, denying credit and agency to the victor.
In case my definition didn’t make it clear, I don’t care for the term choking. Perhaps I am a sensitive Leafs fan, but I like to think I’m built different and believe that playoff success requires the winning team to do something well, and not just one team to screw up royally. But on the other hand, I don’t really put much emphasis on clutch. It’s so easy to look at some event in a hockey game or series and say “if that doesn’t happen, that changes the entire series”. And those statements are almost always true in the same way someone might say that they wouldn’t have been late had they showed up on time: a real case of “if my grandmother had wheels, she’d be a bike”.
So why have I created a “Choke Index”, then? I’ve done so because sometimes teams lose playoff series. And sometimes those series are ones where the losing team had ample opportunity to win, but didn’t. Keep in mind that this metric is not a Disappointment Index. It’s about proximity to winning. I don’t put too much stock into over or under performance here. If you feel differently about a particular series, that’s probably due to your expectations of the losing team.

Component Metrics
Simply put, choking seems to be when a team does not win a series despite reaching scenarios that are proximate to winning — be it from the beginning of the series or some point during it. But choking also happens on a game-level as well as a series-level, and a choke is more “chokey” if it includes both. So to measure chokes, we will need to examine factors that are from outside of the series itself, that span the series itself, and that exist only within games.
(1) Expectation modifier
(a) ROW differential: playoffs might be a new season, but regular season pedigree does mean something for expectations. To allow this model to be applicable to all playoff series across NHL history, we’ll measure the difference in Regulation and Overtime Wins (ROW) between the winning and losing teams. This differential is then divided by the number of regular season games played (then multiplied by 100) to adjust for various season lengths.
(b) Series game differential: this is a very interesting metric, despite its simplicity, because when multiplied to the season-adjusted ROW differential, it either amplifies or diminishes the effect. The series games differential, which we measure as series-Winner Ws minus Choker Ws, has a limited set of outcomes (for a 7-game series): {1, 2, 3, 4}. To see what I mean, let’s look at two different sweeps a decade apart, each involving the Columbus Blue Jackets.
In 2009, the Jackets made the playoffs for the first time in their history off the back of rookie-of-the-year Steve Mason and their star winger, Rick Nash. They faced the defending Cup Champion Detroit Red Wings— who may have had an argument for best team ever were it not for Chris Osgood having his worst regular season (thus far) of his Hall-of-very-good career. In any case, this was not expected to be a close series. Even still, the difference in ROW was only −10: 35 ROW for Columbus, 45 for Detroit. −10/82 x 100 is about −12. But since this is a sweep, that’s multiplied by 4 for a total of −48.73. Essentially, this takes a look at the series results and compares it to the regular season results and says “no one was expecting Columbus to win — and they didn’t.”
In 2019, a different Columbus team was once again going up against one of the best teams of all time in the Tampa Bay Lightning. This time, the sweep was on the other foot. With a ROW difference of +11 (again, this is from the perspective of the losing team), yields a result of 13.41. Multiplied by 4 for the sweep win differential yields a result of 53.65.
(2) Core factors:
These are the core of how I conceptualize choking, and I believe they are at the core of this Index. A lead in hockey means your opponent must score at least two goals to win. This contrasts hockey with baseball, where 4-run leads can be tied in one play; football, where 8-point leads can be tied by one possession (and 6-point leads can be tied in one play); and basketball, where 3-point leads can be tied in one play. The theme is that hockey only allows one score per play, and that score is always worth the same.
So, in order to lose a lead — be it in a series or a game — the other team must score/win at least twice. This is the essence of choking.(a) Total Game-Time Leading: I think this is the big one for measuring a choke — how often did you lead games in this series. It’s a counting stat, so it will naturally favour longer series (which tracks if we think of reverse sweeps as choking par excellence).1 Leading in hockey is usually proximate to winning, but it’s not enough to just be leading. Leading in a game you eventually lose is a surer sign of choking than just leading in a game you win — even though losing a series despite winning games convincingly is also a moderate sign of choking. To reflect this, time leading in losses is doubled that of a win. In the input spreadsheet I used to measure this, I track it in seconds, but then divide by 60 to express it in minutes in the final result.
(b) Total number of leads lost/GA This one is a fairly complicated factor. The rate a team loses leads throughout the series should theoretically indicate how frequently the choking team had chances to hold on to leads, and thus win games outright. My way of counting lost leads probably seems unnecessarily complicated, but there’s a method… I promise, there’s a method. Essentially, any time a team has a lead, they lead until the game is tied again. Ground-breaking stuff. But imagine tying up a game 3-3 after never leading for the entire game. There’s multiple ways to do that. You could have scored after every goal against (1-0, 1-1, 2-1, etc.), scored 3 goals consecutively, or something in between. What this tells us is that we can’t treat three blown 1-goal leads any different than blowing one 3-goal lead. Now, what we can treat differently is when you manage to maintain that lead. While there’s no difference between alternating goals to a 3-3 tie and each team scoring 3 consecutive goals, there is a difference between alternating goals to a 4-3 win and scoring 4 consecutive goals and then conceding 3 goals for the win. Choking is largely seen as a behaviour a leading team exhibits — namely, the inability to properly maintain said lead. Thus, this metric punishes team for conceding leads. Dividing by goals against tries to be cognisant of the scoring environment, but also tries to contextualize what percentage of goals were “comeback goals” and how many weren’t. This leaves us with a number less than 1, so I add it to the quotient of 4 divided by the number of series losses the choker had in order to prorate the best-of-5 series they used to have back in the 80s.
(c) Total games with series lead: this tries to measure the choke on the series-level. How frequently did the choking team have a lead in the series and was thus closer to winning the series more times. This was actually kinda fun to think of, because this factor is a closed set — seems obvious once you think about it, but I typically don’t think of a lot of stats having closed sets, and certainly not one this closed. In a sweep, one team can leads in only 3 games — no one leads at the start of game 1; but in a 7-game reverse sweep, a team only leads the series for 5 games. This means, this set is only comprised of {0, 1, 2, 3, 4, 5}. However, since this number multiplies, I add 1 to it before it goes into the formula. We’ll pretend that the 1 is for Game 1 which is when every series is tied, and thus no one can hold a lead.
(3) Goal differential modifier: higher goal differential is less favourable because it means that the choking team were less “efficient” in their goal allocation (ie ya lost the 1-goal games, ya frauds!). But I need to adjust it before plugging it in. The equation to obtain this modifier is:
(Goal differential + Choker Ls) x 10/Series Games played
The reason is this: even though goal differential is functionally finite, it’s still an open set. This includes positive numbers, like the 1995 series between Calgary and San Jose, in which Calgary had a goal differential of 9. Calgary demolished the Sharks in 3 games, but lost the other 4. That’s choking behaviour to an extent: why were you able to so easily score in some, but not all of the games?
But in a 7-game series, the maximum goal differential in losses is −4, like that infamous Kings-Knights series from 2018 in which each game was a 1-0 Vegas win. So, theoretically, 4 goals against is the fewest goals against required to lose a 7-game series.
So we can imagine that in the closest (game-level) 7-game series imaginable, each game yields a goal differential of 1 for an overall series goal differential of −12. But that’s adjusted up to 3 because those 4 goals are already accounted for by the fact that your team lost. Thus, the formula above sets that as “0”. A positive number is considered “chokier”. You might be wondering why it’s multiplied by 10, and that’s to counteract the fact I adjust it to a per-game rate, and the fact it’s added rather than multiplied. Of all the factors and modifiers, I think this one is least important to understanding choking.
(4) Consecutive Losses Multiplier: this simply measures how many losses in a row you surrendered to lose the series.
We will soon see that this is one of the biggest factors in the model, because it’s multiplied to the previous results —thus amplifying the scores. Essentially, this factor is trying to punish reverse sweeps — but not just 7-game reverse-sweeps. But its purpose is simply to amplify all the previous results. Again, comparing the 2009 WCQF to the 2019 First Round, we see two different sweeps: one already sits firmly in the negatives before we add this multiplier (2009), while the other is in the positives (2019). The 2009 Blue Jackets never held a single lead in that series and thus there was no real expectation that they could win, thus expressed by their negative Choke Index, which is made more negative. The 2019 Lightning, however, held leads in the series, and with their high expectation modifier, their score is amplified.
Here are three things to note.
(1) This multiplier is the “last” factor to be included because it is also the fail-safe. You’ll notice that every team that wins a series wins the final game of it; thus, a winning team will always have a Consecutive Losses Multiplier of 0, meaning every team that wins a series has a Choke Index of 0.
(2) This multiplier also includes an adjustment to the number of games played in the series to account for the best-of-5’s of the 80s, which is as follows: (Consecutive Losses) x 4 / (Choker Ls). This means that reverse sweeps in both 5-game and 7-game series are equal, to account for some of the counting stats that are included in the model.
(3) This multiplier is also divided by ten because otherwise the Index was reaching the 1000s, and I didn’t like that.
This makes the Consecutive Loss Multiplier:
[(Consecutive Losses) x 4 / (Choker Ls)] / 10.
These factors are compiled thus3:
[Expectation Modifier + [(Game Time Lead) x (Leads Lost/Goals Against) x (Games with Series Lead)] + Goal Differential Modifier] x Consecutive Loss Multiplier
That’s a lot of brackets and parentheses, so I number-coded each part of the equation in their description. This is how that looks
(1) = Exp Mod = (1a) x (1b)
(2) = Core Fac = (2a) x (2b) x (2c)
(3) = GDiff Mod = (3)
(4) = ConsecL Mult= (4)
CI = [(1) + (2) + (3)] x 4
Now, is there any deficiencies in my model? Absolutely! It is easily the most tedious thing I’ve ever had to calculate. Converting between seconds and minutes makes my brain hurt like a Gumby — especially when leads change across periods. The number of times I’ve had to remind myself to start from where the game is tied rather than where the lead is taken is a bit embarrassing. So, if you don’t like the results this formula yields, by all means cope because I might have screwed up the math.4 The other deficiency is the goal differential modifier. I’m not sure how to feel about it. It doesn’t really do much and it’s not wholly integral to the actual choke, but I think it’s a decent enough proxy for closeness of score that it should stay.
So, without further ado, let’s see some numbers!
Some Historical Examples
The Sweeps
There are two series that have already been mentioned, above. A tale of two Columbus sweeps.
The 2009 route of the Columbus Blue Jackets was essentially to stress test the model. And stress it did! With a Choke Index of −26.5, it suggests that Columbus had absolutely no realistic opportunity to win this series — they didn’t even lead.
Meanwhile, Tampa Bay in 2019 stress tests the other side: how influential is the Expectation modifier. The answer is fairly. Tampa Bay finished with a final Choke Index of 58.6 — and they didn’t really ‘choke’ except in Game 1. Because in a true choke, the expectations going into the series might be one of the less important aspects (which is why expectations is a modifier, not a multiplier). A choke is not only being expected to win before the series, but also over the course of a series and in the individual games.
A Tale of Two Series
The next type of series are ones that have an unusually low Choke Index despite going a full 7 games. These are series with a very back-and-forth series structure, but lacks any back-and-forth games that go against the series loser or has any overly-dominant wins. Typically, they also have a low goal differential from the losing team’s POV.
The Canucks-Bruins 2011 Cup final fits this profile well. The Canucks blew an early series lead, yes, but those games were close wins. When the Bruins won, meanwhile, it was a typically fairly dominant. Even still, that series results in a Choke Index of about 25.5
Want a 7-games series that fits this profile even better? I’ll even do another one where Boston wins! It’s the lowest Choke Index of any 7-game series I’ve measured.
It’s Leafs-Bruins 2024, with a Choke Index of 4.3!
Now, you might be anything from surprised, to shocked, to offended, to outraged. “But the Leafs choked away a game 7! They can’t win big games!” Yeah, the Leafs lost game 7, and yes, they lead for 81 seconds by my count during the final game, but uhhh, they got goalied. And if we want to actually look at that series critically, the Leafs went 3-1 in 1-goal games. It’s probably a 6-game series if Swayman starts every game instead of just game 1, and then game 3 onwards. Heck, that game 7 might have ended differently if Woll doesn’t get hurt in game 6 or if Samsonov doesn’t have a fantastic bounce-back effort in game 7. So, I will remind readers that you can’t just pick and choose parts of a series to diagnose a choke. Watch your pedals on the way in, Grandma! And please wipe your tires on the mat!
The fact of the matter remains: according to this model — which cares little for eye-tests or “vibes” because (1) I can’t speak to the eye test or vibes of the 1942 Red Wings, for example, and (2) this model tries to measure choking by practical proximity to winning.
But if these series don’t tickle your fancy, we’ll dive into the chokes par excellence: the reverse-sweeps!
The Reverse-Sweeps
As I mentioned earlier, we can think of reverse-sweeps as the ultimate example of choking. You might think of reverse-sweeps as simply winning 3 games, then losing 4 consecutive games. That’s too limiting for our purposes. The consecutive losses to end a series parameter to end a series exists to calculate proximity to reverse-sweeps. But the reason why I call this parameter an amplifier is because it amplifies the other proxies to winning. We saw the limits of this tested with sweeps of the 2009 Blue Jackets and the 2019 Lightning. But what about everything in between?
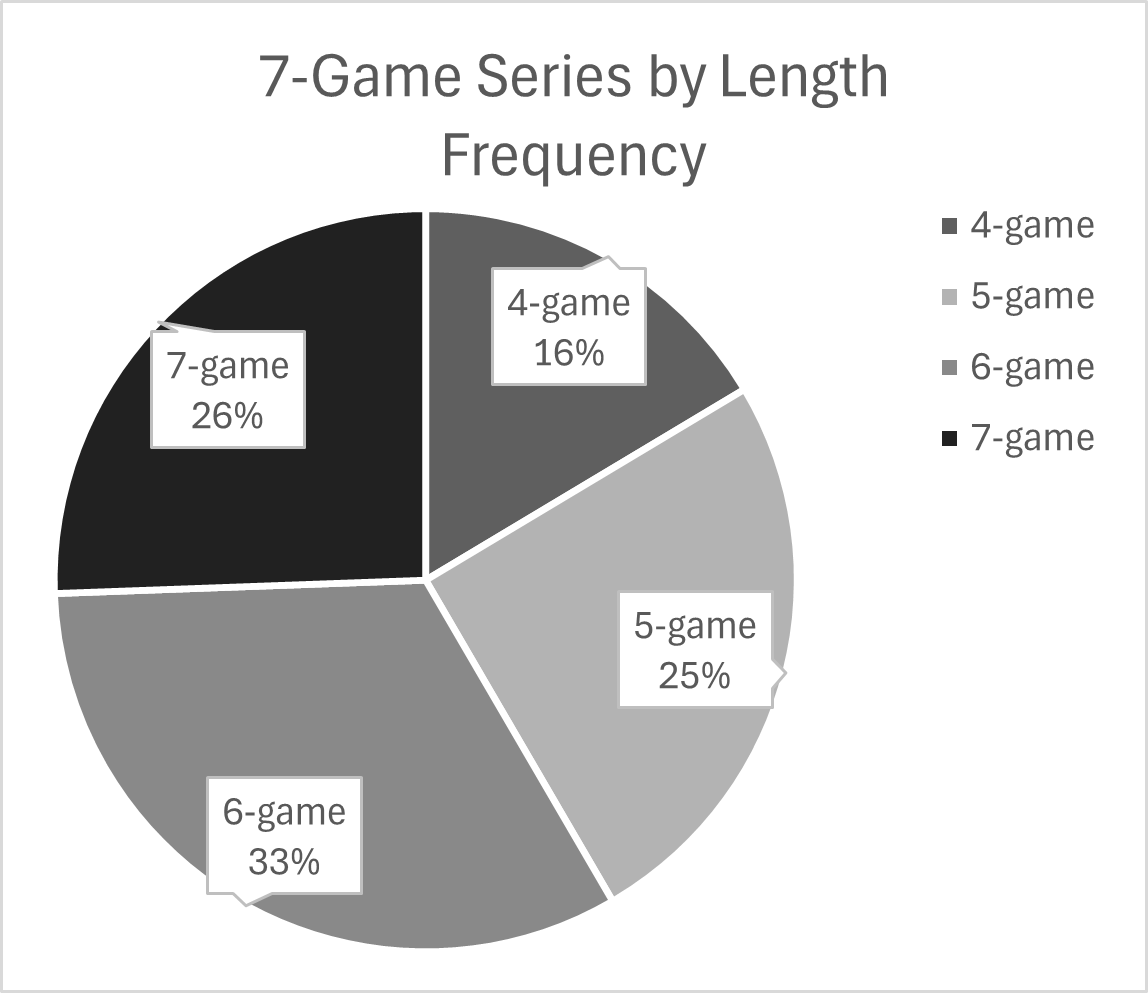
As hockey fans, we can agree that it’s hard to win games in the Stanley Cup playoffs. But as we know, each game must have a winner — thus, it’s paradoxically also rather “easy” to win games in the playoffs. This is evidenced by the fact that the plurality of all series lengths are 6-games (N=32.8%) and 4-game sweeps are rare (N=16.4%) despite accounting for 25% of possible outcomes.5
Furthermore, there are some who say that “you’re never in trouble in the playoffs until you lose at home”. I firmly disagree and posit this position instead: “losing consecutively is dangerous”. And losing consecutively to end a series is catastrophic. I was recently told (albeit rather indirectly) that I should have accounted for the 2025 Leafs blowing a 2-0 series lead, but I already do have such a parameter: games with the series lead. I’m not going to count that twice.
Another way to look at this issue is if you lose consecutive games to end a series you haven’t won a single elimination game.
So, without further ado, let’s run down some full reverse-sweeps (ie. n-1 wins followed by n consecutive losses).
Full Reverse-Sweeps
2014 SJS vs LAK (Kings win 4-3): Choke Index — 293.1
This might upset a few people, but it’s, of course, consistent with the philosophy of my model. You see, the Sharks won games 1 and 2 handily, but they only lead for less than half the game in game 2, despite scoring 7 unanswered goals. Game 3 was tightly contested, needing OT to settle: the Sharks led — and lost their first lead of the series — but it was a coinflip on the scoreboard. They did not hold another lead until game 7, which they did for just under 4.5 minutes. Remember, my model doesn’t just care about how long you lead, but also when you lead. This might look like a full reverse sweep — and it is — but it also has the hallmarks of a “Tale of Two Series” archetype. That’s why it’s the lowest of the 4 full reverse sweeps.1985 WSH vs NYI (NYI wins 3-2): Choke Index — 339.8
Surprise! 5-Game series are tough to judge, but I think this model does them justice. It’s 5 games: everything’s condensed — but given that there’s less time to choke in a 5-game series, why is this one so high. Well, beyond the obvious factors like series shape and all the other ways this models punishes macro-scale choking, it’s the leads lost per GA: a decidedly not nice 1.69. Game 1 saw a 6-goal 2nd period, wherein a 2-0 lead for New York evaporated to 3-2, before the Islanders tied it back up again. Washington later won in OT. Game 2 was much tamer. An early Washington 1-0 lead stood until the 3rd period. Washington wins in double OT this time. Game 3 was tidy and required no OT: a 2-1 Islanders win where Washington never led. Game 4 was chaos. The Islanders scored just over a minute into the game, but the Capitals scored 2 to take the lead, before losing said lead 15 seconds later. 2 goals in the second from the Caps breaks the tie just for them to lose that lead and the game in the 3rd via 4 unanswered Islander goals. Game 5 reads just like game 3, from score to goal ordering. Looking at this series, it’s obvious the hold on it was tenuous: 2 OT wins to start are powerful, but not convincing. It’s that Game 4 that’s the difference between this series and SJS-LAK 2014, from my analysis.1975 PIT vs NYI (NYI wins 4-3): Choke Index — 370.5
Completely forgot about this one, actually. This one is also a “tale of two series”, in a way, but much more drastic. At surface level, the series was turned on its head when Billy Smith was replaced by Glenn Resch in game 4. Pittsburgh’s scoring from the first half evaporated. What separates Pittsburgh from the Sharks and the Capitals is Pittsburgh outright dominated for 3 consecutive games, before going silent for the next 4.1942 DET vs TOR (TOR wins 4-3): Choke Index — 572.0
The original reverse sweep. It’s one of those odd things that happened during WWII, when rosters were rather bare and weird stuff happened. Which should be a lesson for everyone. When these things happen, they’re not normal. There’s reasons. And this is where my true intentions are laid bare: teams over- and under-achieve all the time. It’s not exactly a secret. But teams can underachieve or overachieve and win or lose. But to truly be on the precipice of victory, be it in-game or in-series and lose is something that happens far more frequently than some folks use “choke”. So this is an anti-choke Index: to show that true and complete choking is fairly rare throughout the course of NHL history, and your perceptions are just that.
But back to the series. It’s actually pretty close between this series and the next one I’ll talk about. The difference seems to be from a lower expectation modifier and lower leads lost/GA ratio.
Game 1 was a back-and-forth affair with the teams trading goals to 3-2 Detroit win. Game 2 ended 4-2, with Detroit leading starting just over halfway through the first. Game 3 was a little strange, a 5-2 Detroit win with each team putting up their respective goals consecutively: Toronto went first. Game 4 was a 4-3 Toronto win with Detroit holding 2-0 and 3-2 leads. Game 5 was a 9-3 stomping by Toronto, followed by a 3-0 game 6. Detroit got a 1-0 lead in early in the second period of game 7, but surrendered 3 consecutive goals to Toronto to lose 3-1.2010 BOS v PHI (PHI wins 4-3): Choke Index — 600.6
Oh, Boston. If only you hadn’t lost two of your centres, this might not have happened. But alas. This is probably not shocking to anyone once you figured out I organized this section by lowest-to-highest. This 2010 series is nearly identical the 1942 Detroit reverse-sweep. It really just looks like Boston blew more leads, even though they led less overall. Game 4 was a crazy 5-4 Flyers OT win. Game 7 was a series microcosm: Boston takes a 3-0 lead, Philadelphia comes back to win 4-3. If not for the aforementioned 9-3 stomping Detroit received in 1942, it’s likely that the original is here instead. But if Grandma had wheels…
Other Reverse Sweeps
The fact that some of this one is ranked higher than some of the 7-game reverse sweeps, I believe, is proof-of-concept for this model. It’s not just about leading in games (especially ones you lose), how many games you won, or the order you won them, or blowing a series lead, but it’s a combination of all of those things.
2001 DET v LAK (LAK wins 4-2): Choke Index — 393.0
I don’t think this series is very well-known. In fact, I didn’t know about it before watching a documentary on it by the wonderful Pinholes Graham. This series featured the mighty Red Wings being reverse-swept by the 7th seed LA Kings. Weighing this series down into all-time choke territory was a 26.83 Expectation modifier, 248.85 weighted Minutes Leading — or 41.5% of weighted Regulation Time6— and, of course, 4 consecutive losses to end the series. Detroit’s choke here is explicable, considering they lost Steve Yzerman in the first period of game 1, and then Brendan Shanahan for parts of the rest of the series. I want you to remember this series and consider how historic later on…
IT WAS 3-1!
3-1 comebacks are reverse-sweeps lite and are far more pervasive. One of my tasks for this summer is to supplement my current list of series with this one from Hockey Reference. But here are some series that I’ve already include, to show the true range of this phenomenon.
2010 WSH v MTL (MTL wins 4-3): Choke Index — 91.1
The Halak series. You might be surprised that I haven’t covered Halak at all here. While I am a fan of this relatively short king, I haven’t found the correct angle to approach his career — which is more interesting to me than “goalie catches fire during a playoff run”. Anyways, Halak is actually integral to this story because the reason why this score is so tame is because Washington barely generated offence this series. Goals win games and, for our purposes, create leads. Washington had only 62.35 weighted Minutes Leading and lost only 2 leads all series. This series has a fairly large expectation modifier (N = 20.73) and a positive GoalDiff modifier (N = 8.57), and of course an unfavourable series shape, those are the only things keeping it up so high.2021 TOR v MTL (MTL wins 4-3): Choke Index — 144.5
The single-greatest choke of the Toronto’s Core 4 era. No question. Perhaps not the greatest disappointment, one might argue, but certainly the greatest choke. Besides the same eventual winner, this series shares much in common with the 2010 Caps series. But one thing is different: the Leafs lead for longer. 106.00 weighted Minutes Leading is not the worst for a 7-game series, but unless you’re going blow-for-blow or otherwise catching up, that is certainly going to land you in the choking category.2023 BOS v FLA (FLA wins 4-3): Choke Index — 354.8
An all-time choke for sure — you don’t need me to tell you that — but what’s interesting is two things: (1) that my model considers it more egregious than some reverse sweeps (damn, that 2014 Sharks series was so bimodal), and (2) that it’s not the ultimate non-reverse-sweep. Boston lead a lot during this series, but not as much as some had before them — and they usually weren’t leading in the games they lost. Furthermore, in hindsight, knowing the machine these Panthers became, it actually seems like one of the best teams of all-time got matched up with this decade’s answer to the 2012 Kings: a buzzsaw that needed over half a season to figure things out. Winning consecutive playoff games against these Panthers is something few opponents have managed as of writing: the 2023 Cup-champion Golden Knights, the 2024 Cup-finalist Edmonton Oilers, and the 2025 Toronto Maple Leafs. Wait, what?!2019 VGK v SJS (SJS wins 4-3): Choke Index —368.2
This is something I had forgotten about for while. Possibly due to COVID happening during the season following or the strict non-existence of things that happen after my bedtime. What separates it from the Bruins, you may wonder: weighted Time Leading. This is interesting because the Bruins led each of their 3 wins for over 3000 seconds — aka 50 minutes — and then led for a couple hundred seconds in 2 separate losses. Vegas indeed led for over 3000 seconds in each of their 3 wins as well, but only lead in 1 of their losses. It just so happens that lead was held for over 2 periods of hockey, before that now-infamous 5-minute major. Yikes!
The 2025 NHL Playoffs (thus far) By Choke Index
So, I have been very careful to avoid spoilers for this playoffs, thus far. This is because we are so emotionally close to these series, since they just happened. So without further ado, let’s review the 2025 playoffs, from lowest to highest. A big reason why I wanted to include these is that (despite conceiving of this model and January) I don’t have a good sense of what constitutes a full choke. If there’s a weakness to this model (besides the level of detail it requires, and its labour intensiveness), it’s that the final result doesn’t really mean anything. I think anything over 90 has a good case, but I don’t know where it stops being a choke. The data I’ve collected has been geared towards extreme cases, since I’m looking to test the capacity of this model. Nevertheless, I’ll provide this tentative interpretation:
(−∞, 0.0] — Stomped:
Remember, all series winners automatically get a Choke Index of 0 (since they didn’t lose any consecutive games to end the series). So, technically, it’s possible to lose while still being further from outright choking than the winner. It doesn’t necessarily make a lot of sense, but I think it’s a fun interpretation(0.0, 25.0] — Not a choke:
Usually this is where the modifiers hold a lot of sway, so it’s not exactly much different than a higher score, but it’s clear that this was just an outright loss. Nothing more.(25.0, 50.0] — Not really a choke:
Sure there might have been some proximity to winning experienced during the series, but it’s ultimately clear that this team was not in the driving seat in enough aspects to truly waste an advantage.(50.0, 90.0] — Light choking:
The team in question experienced proximity to winning in some single aspect or moderately across multiple aspects, but not strongly enough to make it egregious.(90.0, 130.0] — Bona Fide choke:
There is clear and definite proximity to winning that was experienced but not converted.(130.0, 200.0] — Severe choke:
You have brought shame upon your franchise.(200.0, ∞) — All-Time choke:
In the words of philosopher Robbie Rotten, “This is going down in history!”
Keep in mind that this metric is not a Disappointment Index. It’s about proximity to winning. I don’t put too much stock into over- or under-performance here. If you feel differently about a particular series, that’s probably due to your expectations of the losing team.
MTL v WSH (WSH wins 4-1): Choke Index — 1.4
One of the lower results I’ve recorded, Montreal manages to get away with such a low Index despite losing two in a row to close out the series. What drives this score is the ~42 weighted Minutes Leading and a fairly low Lead Lost/Goals Against (0.222).7 Bu the real deciding factor is the −40.2 expectation modifier. Montreal is the Second Wild Card: they’d have had to be actually holding leads, losing leads, or winning games for this to even approach a bona fide choke.DAL v EDM (EDM wins 4-1): Choke Index — 7.3
Here’s an odd case where a lower Choke Index is almost more damning than a higher one: Dallas was never really in this series. Dallas’s 16 weighted Minutes Leading is the second-lowest I’ve recorded, only above the 2009 Columbus Blue Jackets, who did not lead at all. What further drives this low result is the fact that Dallas technically never lost a lead — something they also share with the 2009 Jackets. Add in a −11 Goal differential (surfacing in the formula as a −14 GoalDiff modifier), and this is a recipe for a pretty low score. But if it resembles that Columbus series so much, why is it so high. Well, the Stars and Oilers had equal number of ROW wins, which neuters the expectation modifier entirely, and it’s due to the fact that this qualifies as a very rare 5-game reverse sweep.8OTT v TOR (TOR wins 4-2): Choke Index — 7.9
Proximity to winning is everything in this model. And these Ottawa Senators had to fight hard to get even remotely close — something acknowledge by the single-digit score (is it still single-digit if I include a decimal? We’ll pretend it is). What drives this low score is a few things cancelling. A decently high 78 weighted minutes leading is counter-balanced by a pretty low −17.1 expectation modifier. The goal differential modifier (1.67) is a non-factor, here and Ottawa lost game 6 after winning back-to-back games. So, it’s fairly straight forward.CAR v FLA (FLA wins 4-1): Choke Index — 9.1
Zounds, the Conference Finals were quite cromulent this year! Despite series length suggesting it could be fairly comparable to the Western Conference Final, these series arrive at their scores in notably different ways. There are many similarities, from identical goal differentials and GoalDiff modifiers, to similar Leads Lost/Goals Against (0.095 for this series) to similar number of games with the series lead (0, in this case, but remember I assign game 1 to every series to prevent breaking the model). What causes the gap is the series shape. Carolina won game 4, meaning everything is multiplied by only 1, compared to the reverse-sweep mentioned above. But Carolina also led for significantly longer than Dallas did: about 76 weighted minutes, overall. Another major difference is Carolina had more ROWs, by a fair amount, leading to a 22.0 expectation modifier.WPG v DAL (DAL wins 4-2): Choke Index — 15.2
I’ll admit, I’ve already forgotten a lot about this series. Shutouts in Games 2 and 5 inflate the fairly high 112 weighted minutes average, but also minimizes the Leads Lost/GA. Series shape is as favourable as can be with wins in a game other than game 1 and game 5. What actually makes this series so high is the 14.63 expectation modifier and the 8.3 GoalDiff modifier.EDM v FLA (FLA wins 4-2): Choke Index — 18.0
Not much to say about this one, despite it being the Cup Final. Sure, Edmonton lost more leads than is typical, but they also double-dipped a low expectation modifier (−11.7) and GoalDiff modifier (−17.1). This largely offsets their consecutive losses to end the series. This really shouldn’t be a surprise given how this series shook out in its latter half.TBL v FLA (FLA wins 4-1): Choke Index — 19.3
It’s been said that these playoffs have had an unusual affinity for 5-game series. This one sits in a weird mid-tier: not quite like each two conference Finals, sitting in single-digits, nor indeed like Carolina’s first and second round series, nor again like Edmonton’s second round against Vegas. Again, the answer is fairly simple: it actually is like one of the Conference Final — the Eastern one. The only significant difference is series shape. Tampa’s 2 consecutive losses to lose the series are what accounts for most of the difference.NJD v CAR (CAR wins 4-1): Choke Index — 27.8
Here is Carolina’s first of three 5-game series in these playoffs. This series does feel right at home in the upper twenties because some of these factors were fairly high and others were not. What I mean is that things like their two consecutive losses to end the series were relatively high, as were the 126.18 weighted Minutes Leading and 0.368 Leads Lost/GA. But this series also had a −25.60 Expectation Modifier and a −8.0 GoalDiff Modifier. So, in that sense, it makes sense how we got here.WSH v CAR (CAR wins 4-1): Choke Index — 28.4
Despite having similar shape and Choke Index to the New Jersey series, this one is actually closer in most of its metrics to the ECF. The only major difference — besides who actually won — is the series shape: Washington lost three consecutive, making their score significantly higher than Carolina’s ECF.STL v WPG (WPG wins 4-3): Choke Index — 41.1
This is, weirdly enough, a superlative series: the longest in weighted Time Leading. Appropriately, this is due to, in part, that memorable game-7 game-tying goal with less than two seconds to go in regulation. The rest of this is accounted for in what the rest of the series was known for: the home/away splits. St. Louis dominated at home, but the games were much closer in Winnipeg. But since the series started in Winnipeg, that means the Blues were also always playing catch-up in the series. This would have qualified as my “a tale of two series” archetype had Jets lost (grandma, what big handlebars you have!). It differs from those inasmuch as the dominant team in this case ended up losing the series. I think being in the 40-range for a 7-game series is indicative of an underlyingly good series, so nothing to be ashamed of here.VGK v EDM (EDM wins 4-1): Choke Index — 44.0
This, meanwhile, is rather high for 5-game series. If the plethora of 5-game series has taught us anything, it’s that we can still get a range of results from the same length of series. I believe that’s a testament to this model’s construction. In this one, 2 consecutive losses are certainly at play, but so is the 143 weighted Time Leading — that’s equivalent to about 2 full games, plus a period in wins, or 1 game and half a period in losses. Game 1 was killer: Vegas lead for nearly two full periods in that one and surrendered a 2-goal lead. It’s the kind of game that could have really become an anchor in a longer series. My model doesn’t measure individual games, and I’m fine with that, but damn, that was something for sure.TOR v FLA (FLA wins 4-3): Choke Index — 67.7
Yes, folks, this series is not the worst choke of the playoffs. Losing 6-1 twice in the same series is not choking behaviour, it’s getting facially bludgeoned behaviour. Game 3 did not help, nor did series shape, with the Leafs holding the series lead for 3 games (4, counting game 1) — but having to come back to even play a game 7 actually helps them here9. The GoalDiff modifier (N= −7.14) is kind to the Leafs here, cutting their Expectation modifier nearly in half (N=12.20). Furthermore, the 145 weighted Minutes Leading isn’t egregious for a 7-game series.
This is the kind of series that exemplifies the need for this model: to cleave apart that impression of disappointment and unmet expectations that are elicited from underperformance and chokes, alike, and reveal which one was actually due to proximity to winning. Because if impressions were reality, maybe the media buzz surrounding the Leafs in both optimism and pessimism could actually be taken to the bank instead of being mere hot air.COL v DAL (COL wins 4-3): Choke Index — 70.3
Another way this playoff has been unique is in the prevalence of positive goal differentials from winning teams. This was another such one. Even though Colorado’s goal differential modifier of 10.0 isn’t the highest in these playoffs, it’s still abnormally high. Likewise, 252 weighted Minutes Leading wasn’t the highest, but still fairly high. Even still, Colorado is saved from this being an outright choke by series shape. So much salvation in this model can be found by just winning the right games. I don’t believe this is a defect: it’s not a choke if you won your penultimate game — because you never actually reached a position where you could actually put the series away.MIN v VGK (VGK wins 4-2): Choke Index — 96.9
This one kind of shocked me, but then I remembered that Minnesota was up 2-1 at one point in this series, and then things started to make a little sense. 3 straight losses will do that. But other than that, this series is fairly normal. 153.7 weighted time leading is a bit high as is the 7.14 goal differential modifier, but the latter of which is made up for by the −8.5 expectation modifier. But it’s clear that Minnesota won their two games convincingly and lost 4 closer games.LAK v EDM (EDM wins 4-2): Choke Index — 480.1
I’ve taken great pains to not mention this series at all in this article, despite the historic status of this series. Perhaps you might have already made the connection to this series by its similarities to the 2001 Detroit series, with its similar series shape, its reverse sweep status, and even its shared franchise participant. I don’t recall the media making a big deal of this, way back 1 month ago. If anything, I’m not so much shocked by this result as I am by the narrative surrounding this. This is not a “collapse”; this is not a “choke”; this is just another elimination at the hands of the Edmonton Oilers. The forest is missed for the trees. But anyways, let’s start with the expectation modifier: 17.1. This is borne largely by the 7 ROW differential between the Kings and Oilers — which is more than I remember. But then there’s the 255 weighted Time Leading. That’s a pretty high amount for any series, but especially for a 6-game series. Add-in the 4 consecutive losses, 2 games with the lead, and —most shockingly— over half of their goals against ultimately contributed to lost leads (N = 0.542), there is little doubt that this is deservedly an all-time choke.
The Choke-Index Table:
Final Thoughts
Proximity to winning is the essence of choking. If you find yourself vehemently disagreeing — and there’s no shame in that, I do it all the time — with this list, please remember that it is based solely on said premise. It’s not a Disappointment Index. So this if this doesn’t put a number to your feelings towards a series — good news! It’s not supposed to.
One change I will consider is weigh time leading by game number as well as by outcome. This might do better at properly quantifying the timing of certain events and involve more empirical aspects rather than just an arbitrary coefficient, like I have chosen. It might look something like (Historical win percentage of pre-game series state + 0.500) x Time Leading or, for example:
Game 1 (series 0-0): ((0.500) + 0.500) x TmLd = 1 x TmLd
Game 2 (series (1-0): ((0.681) + 0.500) x TmLd = 1.181 x TmLd
etc.
But I’m not sure if that would punish teams for leading in games they’d eventually lose (itself, a form of choking) as much. I’ll need to find a balance.
Also, I might remove the expectation modifier. It’s not as big of a deal because it mostly influences the lower series, but it’s not fully philosophically aligned with the rest of the model. For now, however, it is complete.
Caveat: the final sum is multiplied by 4 divided by the number of Choker Ls, to prorate any series to a best-of-7-equivalent.
This is an actual series: Rangers vs Capitals 2015. This documentary on the series by the amazing Pinholes Graham has my highest recommendation.
Please, please remember your BEDMAS/PEMDAS.
If anyone has data-scraping advice or resources where I could learn, that’d be greatly appreciated.
This is a measure of series regulation time (i.e. time were leads can be held), but reweighed to match weighted Time Leading. In this case it’s (60 min x 4 Losses x 2) + (60 minutes x 2 wins) = 600 weighted
Remember, 1 is added before it’s added to the formula
I need to look into fixing that — I’ll admit, silly as it sounds, I didn’t anticipate that happening
Something these Leaf teams don’t get nearly enough credit for is being good in Game 6s — which have more often than not been elimination games for them.